

MiniJPAS-AMICO catalogue of Galaxy Clusters
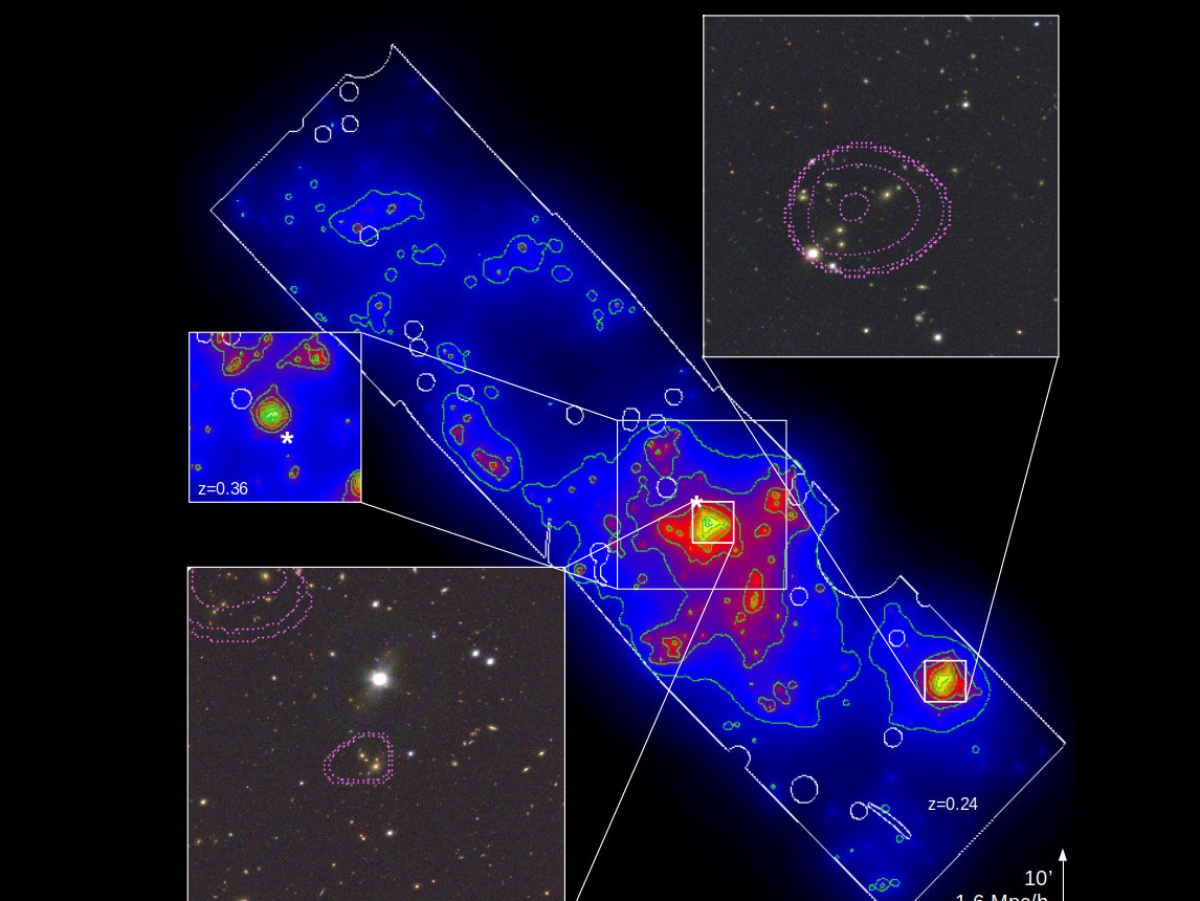
In the background, the response of AMICO to the presence of galaxy clusters for a redshift slice z=0.24. In the top right and bottom left boxes the optical images of the miniJ-PAS data of two clusters together with the isocontours displaying the X-ray emission measured with Chandra. The top left box shows another detected cluster laying at a higher redshift, z=0.36 well disentangled by the foreground structures.
Samples of galaxy clusters disclose the physics at play in galaxy formation and allows to constrain cosmological models once their mass, position (for clustering studies) and redshift are known. Within this context, large optical data sets play a crucial role.
We present the galaxy groups and clusters based on the mini-JPAS data and the AMICO algorithm (Adaptive Matched Identifier of Clustered Objects). The mini-JPAS data cover an area of 1 deg2 centered on the AEGIS field to the same depths, with the same 54 narrow band plus 2 broader band near-UV and near-IR filters anticipated for the full J-PAS survey.
We use AMICO to detect and characterize groups and clusters of galaxies down to S/N=2.5 in the redshift range 0.05<z<0.8 and a mass larger than M200>1013 Msun/h. We derive mass-proxy scaling relations based on Chandra and XMM-Newton X-ray data for the signal amplitude returned by AMICO, the intrinsic richness and a mass proxy incorporating the galaxies’ stellar masses. The latter proxy is made possible thanks to the J-PAS filters and shows a smaller scatter with respect to the richness. We fully characterize the sample and use AMICO to derive a probabilistic membership association of galaxies to the detected groups that we test against spectroscopy. We further show how the narrow band filters of J-PAS provide a gain of up to 100% in signal-to-noise ratio in detection and an uncertainty on the redshift of clusters of only σz=0.0037(1+z) placing J-PAS in between broadband photometric and spectroscopic surveys. A list of Brightest Group Galaxies (BGGs) is also provided.
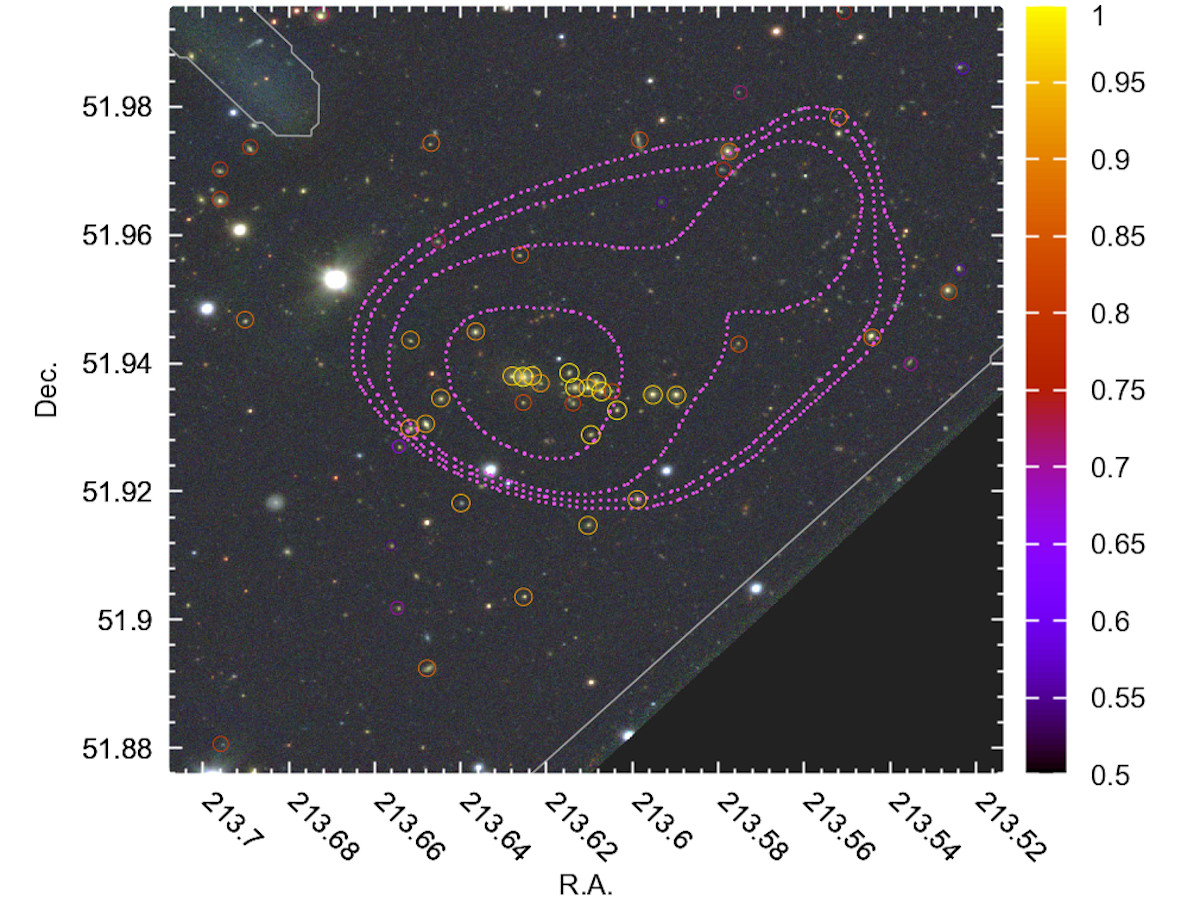
Figure 1. The largest cluster detected in the miniJ-PAS data with AMICO. The circles show the probabilistic association of galaxies to this cluster ranging from 100% (yellow) to 50% (purple). The isocontours show the intensity of the X-ray emission measured with Chandra.
Data download
GALAXY GROUPS AND CLUSTERS CATALOGUE
DATA DOWNLOAD: minijpas_amico_galaxy_groups_and_clusters.tar.gz (8.5kB)
README: minijpas_amico_README_galaxy_groups_and_clusters.txt (3.4kB)
CLUSTER MEMBERS CATALOGUE
DATA DOWNLOAD: minijpas_amico_cluster_members.tar.gz (574.1kB)
README: minijpas_amico_README_cluster_members.txt (1.6kB)
BRIGHTEST GROUP GALAXIES (BGGs) CATALOGUE
DATA DOWNLOAD: minijpas_amico_brightest_group_galaxies_bggs.tar.gz (7.2kB)
README: minijpas_amico_README_brightest_group_galaxies_bggs.txt (1.6kB)
How to cite
If you have used this data in your paper, please cite the following paper:
If you have any issue or doubt write to maturi@uni-heidelberg.de.